I treat a traffic drop google update correlation as plausible only when the timing, ranking pattern, and scope all line up. A traffic decline that starts during a confirmed Google rollout, affects many previously strong queries or pages, and coincides with wider SERP volatility is stronger evidence than a simple date match. The fastest way to test the theory is to confirm the update window, compare Search Console data from before and after the rollout, segment the loss by page and query, and then rule out technical, demand, security, manual-action, and SERP-layout causes. That sequence matters because Google itself lists algorithmic updates as only one of several reasons organic traffic can fall. I also avoid treating every drop during an update as proof of causation. Google Search results move continuously, and a site can lose clicks because search demand changed, a competitor became more relevant, a migration introduced indexing problems, or a new result feature reduced click-through even when average positions look similar. The practical standard is evidence from several independent signals, not one graph and not one volatility tweet.
This distinction matters more in 2026 because notable ranking changes can happen close together. Google’s Search Status Dashboard shows a May 2026 core update from May 21 to June 2, a June spam update from June 24 to June 26, and an August spam update that began on August 18 and lasted about two days and sixteen hours. A site that lost traffic in late May, late June, or mid-August therefore has legitimate update windows to investigate, but the diagnosis still has to be site-specific. I start with the exact date the change became visible in Google Search Console, then ask whether impressions, clicks, and positions moved together, whether the loss is sitewide or concentrated in a directory, whether the affected queries show the same demand in Google Trends, and whether independent rank-tracking datasets show broader turbulence. This guide gives you that complete workflow, including what evidence strengthens an algorithm hypothesis, what evidence weakens it, when to wait before making changes, and what to document before you touch content.
What This Means for Site Owners and SEOs
A suspected Google update should change the order of your investigation, not trigger an immediate rewrite. First establish whether the loss is actually organic Search, whether it is a ranking problem, and whether the pattern overlaps a confirmed update. Google’s current traffic-drop debugging guidance explicitly separates algorithmic changes from technical issues, security problems, spam issues, seasonality, changing interests, and site moves. That means the responsible response is diagnostic before it is editorial.
For a site owner, the goal is to avoid expensive false positives. If a developer accidentally shipped a noindex directive, rewriting content will not restore visibility. If demand for a seasonal query collapsed, removing pages can make the site weaker. If clicks fell because a richer result format occupies more of the page, average position alone can give a misleading picture. For an in-house SEO, the main job is to isolate the affected template, topic, market, device, and search type. For an agency, the additional job is to document enough evidence that a client can see why you are classifying the event as algorithmic, technical, demand-driven, or still unresolved.
AlgoUpdateTimes can support the first timing check with its Update Impact Checker, while the site’s Algorithm Updates archive provides a place to review update coverage. Timing is only the first filter, though. A confirmed rollout overlapping your decline raises the probability of update impact, but it does not prove that the rollout caused the decline.
How to Verify a Traffic Drop Google Update Correlation
The strongest traffic drop google update diagnosis combines four things: an exact onset date, an official Google rollout window, a matching ranking pattern in Search Console, and corroborating movement outside your own site. If one of those pieces is missing, keep the conclusion provisional.
Step 1: Pin Down the First Meaningful Change
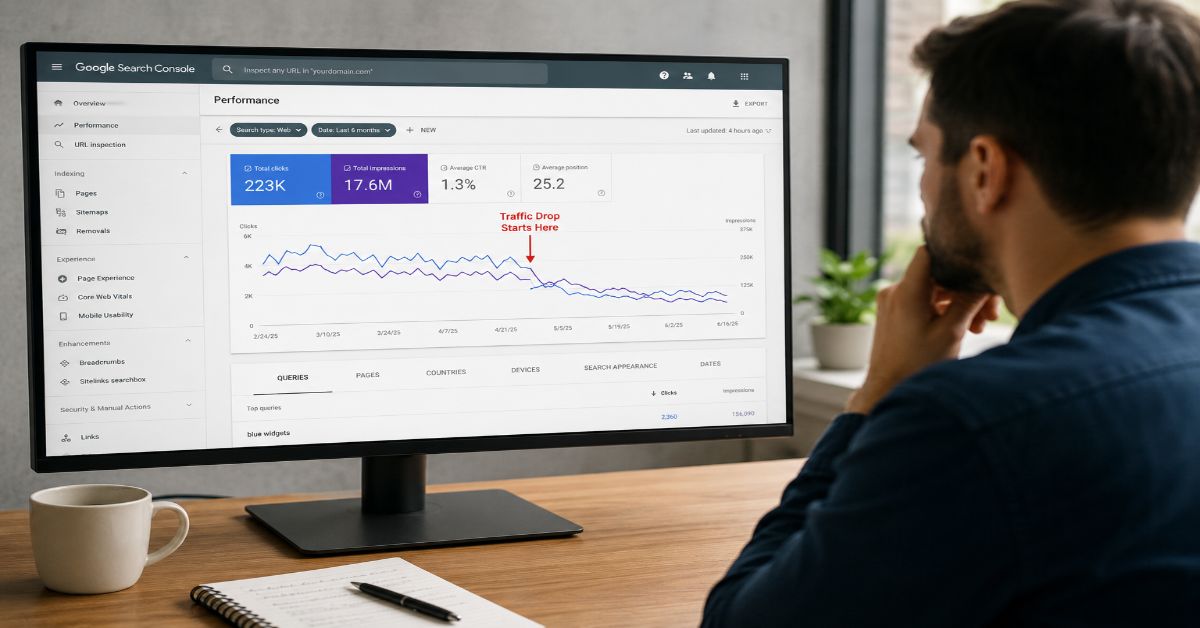
Start with Search Console rather than analytics because Search Console measures Google Search exposure directly. Identify the first date when clicks, impressions, or average position shifted beyond normal day-to-day variation. Do not use the date someone noticed the problem in a dashboard or Slack message. Use the date the data changed. If the site has weekly seasonality, compare the same weekdays and look at at least several weeks of baseline behavior. A one-day dip followed by a rebound is weak evidence. A persistent break in the trend is more important.
Then determine whether the loss began everywhere at once or appeared gradually. A sharp sitewide ranking break can be consistent with a major algorithmic or technical event. A slow decline limited to older pages may point to relevance decay, competitive displacement, changing demand, or internal quality differences. If only one section moved, record the directory, template, content type, and primary query cluster before you make any interpretation.
Step 2: Confirm the Official Rollout Window
Check the Google Search Status Dashboard ranking history and record the official start and end dates. This matters because core and spam updates can roll out over days or weeks, and movement can occur at different points during the rollout. A decline that begins two weeks before an update is announced should not be retrofitted to that update. Likewise, a loss during the rollout deserves investigation but still needs performance evidence.
Recent 2026 history illustrates why precision matters. Google’s dashboard records the March 2026 core update as starting March 27 and lasting 12 days and 4 hours, the May core update as starting May 21 and lasting 11 days and 21 hours, the June spam update as starting June 24 and lasting 2 days and 1 hour, and the August spam update as starting August 18 and lasting 2 days and 16 hours. These windows are not interchangeable. If your drop started June 10, for example, neither the May core rollout nor the June spam rollout is an exact timing match.
The table below shows recent official ranking-update windows that can be used as timing checkpoints in a 2026 diagnosis.
| Update | Start date | Official duration | Diagnostic context |
| March 2026 core update | March 27, 2026 | 12 days, 4 hours | Core ranking reassessment |
| May 2026 core update | May 21, 2026 | 11 days, 21 hours | Core ranking reassessment |
| June 2026 spam update | June 24, 2026 | 2 days, 1 hour | Spam systems; Google said global and all languages |
| August 2026 spam update | August 18, 2026 | 2 days, 16 hours | Spam systems |
Step 3: Compare the Right Before-and-After Periods
For core updates, Google recommends waiting at least a full week after the rollout finishes before analyzing the effect, then comparing that period with a week before the update began. That advice reduces the risk of drawing conclusions while results are still moving. It also keeps you from comparing a partial rollout week against a stable baseline and calling normal rollout turbulence a permanent loss.
Use several comparisons, not one. Compare the week after the waiting period with the week before rollout, then compare 28-day periods to smooth weekday effects, and where seasonality is strong compare year over year. If all three comparisons point in the same direction, confidence increases. If week-over-week is down but year-over-year is flat or up, the apparent update impact may be exaggerated by seasonality or a recent short-term spike.
What Search Console Pattern Actually Suggests Update Impact?
An algorithm-related decline usually becomes clearer when Search Console shows how clicks, impressions, and positions changed together. Google’s Performance reporting uses four core metrics: clicks, impressions, click-through rate, and average position. The useful question is not simply whether clicks fell. It is which combination of those metrics changed, on which pages and queries, and across which search surfaces.
Read Clicks, Impressions, and Position Together
If clicks and impressions both fall while average positions deteriorate across many high-value queries, the evidence is consistent with lost search visibility. If clicks fall but impressions and positions remain relatively stable, investigate click-through rate and the search results page itself. If impressions fall while position is stable, demand may have fallen, query matching may have changed, or Google may be showing your pages for fewer variants. If only clicks fall on mobile, the cause could be device-specific SERP layout rather than a broad ranking reassessment.
Google cautions against over-focusing on absolute average position because clicks and impressions are the outcomes that matter. Position is still useful as a diagnostic signal when the change is dramatic and persistent. A site that moves from top-three visibility to the second or third page for a broad set of queries has a different problem from a site that moves from position two to four while impressions stay strong.
Use this evidence matrix to interpret the most common Search Console patterns before assigning a cause.
| Observed pattern | What it suggests | What to investigate next |
| Clicks down; impressions down; positions worse | Lost search visibility is likely | Algorithmic shift, relevance loss, competitor gains, or technical indexing issue |
| Clicks down; impressions stable; positions stable | CTR or SERP-layout issue is more likely | SERP features, AI experiences, snippets, ads, device layout, title appeal |
| Impressions down; positions stable | Demand or query-matching change is possible | Seasonality, changing interests, fewer relevant query variants |
| Only one directory or template drops | Localized issue, not automatically sitewide | Template defect, topical reassessment, internal linking, content-quality cluster |
| Only one device or country drops | Segment-specific cause is likely | Mobile SERP layout, regional intent, localization, device rendering |
Segment by Page and Query Before You Call It Sitewide
Sort pages by click difference between the comparison periods. Then inspect the queries attached to the biggest losing pages. You are looking for repeatable patterns: a topic cluster, a directory, a page type, a country, a device, or a search appearance that accounts for a disproportionate share of the decline. Google’s current debugging documentation specifically recommends reviewing the Pages table and separating Web, Images, Video, and News when relevant.
This is where many update diagnoses improve. A 25 percent domain-level decline can be caused by one high-volume directory losing 60 percent while the rest of the site remains stable. That is not the same as a broad domain reassessment. Conversely, a modest domain-level decline can hide a serious pattern if almost every commercial page lost similar positions while informational traffic grew. Segment first, summarize second.
Use Device, Country, and Search Appearance as Control Groups
A clean algorithm signal often repeats across multiple slices, but not always. Search results differ by device, location, language, and feature set. If the loss is isolated to mobile while desktop rankings and impressions are steady, examine mobile layouts, SERP features, and technical rendering. If only one country falls, compare local competitors and demand. Search Engine Land has also highlighted device segmentation, search appearance, and crawl statistics as useful Search Console reports when standard page and query comparisons do not explain a loss.
How Do You Rule Out Technical Problems Before Blaming an Update?
You rule out technical causes by looking for crawl, indexing, serving, migration, and security evidence that can independently explain the same traffic loss. This check should happen before major content changes because a technical failure can mimic an algorithmic drop almost perfectly at the traffic level.
Check Indexing and Crawl Signals
Open the Page indexing report and inspect whether indexed page counts changed around the same date. Review examples of excluded or erroring URLs, especially for templates that lost traffic. Use URL Inspection on representative winners and losers. For larger sites, review crawl statistics and server logs for changes in response codes, crawl volume, robots.txt access, redirects, or repeated 5xx errors. Google’s Search Console documentation points site owners to indexing, URL Inspection, security, and performance reports for exactly this kind of diagnosis.
Common causes include accidental noindex directives, canonical changes, robots.txt blocks, redirect chains, broken internal links, JavaScript rendering regressions, server instability, and template changes that remove important content or links. A technical release that lands on the same day as a Google update is particularly dangerous because teams naturally blame the update. Build a deployment timeline and compare it to the traffic timeline before deciding.
Check Site Moves and URL Changes
Google notes that URL-changing site moves can produce ranking fluctuations while the site is recrawled and reindexed. A medium-sized site can take a few weeks for Google to process. If the decline follows a migration, protocol change, hostname move, CMS switch, or large-scale URL rewrite, migration evidence may be more persuasive than an overlapping algorithm rollout. Verify redirects, canonicals, sitemaps, internal links, status codes, and old-to-new URL mapping before you attribute the loss elsewhere.
Check Manual Actions, Security, and Spam Signals
Algorithmic changes and manual actions are different. Search Console’s Manual Actions and Security Issues reports can reveal problems that should not be lumped into a core-update diagnosis. Google also distinguishes non-spam updates from spam updates. If a decline aligns with a spam rollout, review the site against Google’s spam policies, but do not assume every affected site has a manual action. Automated spam systems can affect ranking without a manual action appearing in Search Console.
How Do You Separate Seasonality and Demand From Algorithmic Loss?
Demand changes are separated from algorithmic losses by comparing your Search Console query trends with external search-interest data. If people are searching less for the topic, a traffic decline can occur even when rankings remain stable. Google recommends Google Trends for this exact distinction and notes that Trends uses aggregated, anonymized, categorized search data to show how interest changes across time and geography.
Take the top queries responsible for the click loss and test them in Trends over a long enough period to reveal annual cycles. Use the same country when possible. If several high-volume queries show a predictable seasonal decline that matches prior years, seasonality is a stronger explanation. If external interest is stable while your impressions and positions fall sharply, a site-specific visibility problem becomes more likely. If external interest falls but your positions also deteriorate, both forces may be operating at once.
For news, ecommerce, travel, finance, and other demand-sensitive sectors, also compare the affected topic against related topics. A product category can lose search volume because a new model, terminology shift, or competitor brand changed what users search for. In that case, the right response may be editorial expansion or product strategy, not ‘recovery’ from an update. The SEO Basics section on AlgoUpdateTimes can serve as a useful internal reference for teams that need to separate fundamental search-demand questions from algorithm-specific analysis.
How Should Rank Trackers and Volatility Tools Be Used?
Volatility tools are corroborating evidence, not a verdict. Their value is that they show whether many search results are moving at the same time, which helps you distinguish an isolated site problem from broader SERP turbulence. Their limitation is that each tool tracks its own keyword set, markets, devices, and calculation method, so a spike may not reflect your niche and a calm global score does not rule out a local or vertical-specific change.
Semrush Sensor: Broad Daily Movement
Semrush explains that Sensor checks a fixed set of keywords daily, compares today’s results with yesterday’s, and uses Levenshtein distance as part of the calculation before normalizing the result into a volatility score. That makes Semrush Sensor’s methodology useful for identifying unusual daily SERP movement. Use it as a context layer beside your own tracked keywords, not as proof that Google changed a specific ranking system affecting your site.
SISTRIX Visibility Index: Domain-Level Context
SISTRIX says its Visibility Index is recalculated daily using 100 million data points and covers more than 100 million domains across 40 countries. The value of SISTRIX Visibility Index data is different from a raw traffic metric: it can show whether a domain or directory gained or lost measurable organic visibility even when analytics are distorted by seasonality, consent changes, or conversion tracking. Comparing your domain with close competitors can reveal whether movement is broad across a niche or concentrated on your site.
Advanced Web Ranking: Query-Level SERP Stability
Advanced Web Ranking’s SERP Volatility report measures how much URL rankings move between updates and groups volatility into low, medium, and high bands. Its documentation describes 0 to 6 as low, 6 to 9 as medium, and 9 to 10 as high volatility. It also tracks URLs that improved, declined, entered, or dropped, plus search-intent changes. That makes AWR’s SERP Volatility report especially useful when your own keyword set matters more than a global weather score.
The best practice is triangulation. If Search Console shows a sharp ranking loss beginning during a confirmed rollout, your tracked keywords show broad movement, and two independent volatility systems spike around the same period, the algorithm hypothesis becomes materially stronger. If your site falls while the wider SERPs and close competitors remain stable, look harder at site-specific technical, content, relevance, or link factors.
What If the Drop Lines Up With a Core Update?
If a sustained ranking decline lines up with a core update, wait until the rollout is complete, compare the correct periods, and evaluate the affected pages and the site as a whole before making large changes. Google’s current core-update guidance explicitly advises against drastic action for small position shifts and recommends a deeper assessment for large, sustained drops.
Google uses a simple example to distinguish the two. A move from position two to four is a small drop that may not justify radical changes. A move from position four to twenty-nine is a large drop that calls for deeper assessment. The numbers are examples, not universal thresholds, but the principle is important: severity and breadth determine how aggressively you investigate.
For a large decline, review whether the affected content is still the best answer for the query, whether it demonstrates first-hand experience or subject expertise where appropriate, whether key facts are current, whether the page satisfies the dominant search intent, and whether the site has thin, duplicative, or search-first sections that weaken the overall experience. Compare losing pages with the pages that replaced them. The useful question is not ‘what factor did Google change?’ but ‘what does the current result set reward that our page or site is not delivering as well?’
Avoid chasing unsupported theories or making dozens of changes at once. Google says some improvements can be reflected in days, while others can take several months as systems reassess a site over time. It also warns that there is no guarantee any particular change will produce a noticeable ranking improvement. That is why controlled, user-centered changes are better than reactionary rewrites.
Danny Sullivan, then Google’s Public Liaison for Search, captured the core-update principle in an official announcement: ‘there might not be anything to fix at all.’ The point from Google’s May 2022 core update post still applies. A ranking loss after a core update is not automatically a penalty. It can reflect Google reassessing which results are most useful relative to other available content.
If the evidence supports a core-update impact, document the diagnosis and then use the site’s Ranking Recovery section as the natural internal path for recovery-oriented guidance. Keep the recovery plan tied to identified weaknesses rather than generic SEO checklists.
What If the Drop Lines Up With a Spam Update?
A spam-update overlap calls for a different review because Google is specifically improving systems that identify or neutralize spam. The June 2026 spam update, for example, began June 24 at 09:00 Pacific and finished June 26 at 10:00 Pacific. Google’s incident notice said it applied globally and to all languages. The August 2026 spam update began August 18 and the status history records a rollout of about two days and sixteen hours.
Start by reviewing the relevant Google spam policies and the parts of the site that lost the most visibility. Look for patterns involving scaled low-value pages, copied or lightly transformed content, manipulative link practices, doorway-like pages, expired-domain strategies, hidden content, or other tactics that could be interpreted as search manipulation. Do not assume a site is affected just because traffic fell during the window. The same evidence standard still applies: timing plus affected query patterns plus ranking loss plus broader context.
Also distinguish a spam-system impact from link devaluation. Sometimes a site can lose ranking benefit because Google discounts links or other signals it previously counted. That can feel like a penalty even if there is no manual action to remove. The correct response is not to manufacture replacement signals quickly. It is to remove or stop problematic practices, strengthen the site’s legitimate value, and allow Google to reassess the site over time.
Can AI Overviews or SERP Features Cause a Traffic Drop Without a Ranking Drop?
Yes. A site can lose clicks even when its measured organic position changes little, because the search results page can change around it. New or expanded features, richer answers, image or video modules, local results, shopping units, discussions, and AI-generated experiences can alter how much attention a traditional organic result receives.
Google’s Search documentation changelog on August 15, 2026 clarified that AI Overviews are counted and logged in Search Console’s Performance report, using the same general reporting methodology Google applies to other Search features. That clarification is important for diagnosis. If clicks decline but impressions and positions remain relatively stable, do not force an algorithmic ranking explanation. Review query-level CTR, search appearance where available, device differences, and live SERPs for the highest-loss terms.
This is also why rank trackers that preserve SERP snapshots or report feature changes are useful. Advanced Web Ranking, for example, can show when People Also Ask, video, or other features appear, disappear, or move. A traffic decline can therefore be a visibility-within-the-page problem rather than a ranking-position problem. The remediation may involve format, content type, structured data where eligible, or a broader content strategy instead of conventional ‘recovery.’
A Practical 60-Minute Diagnosis Workflow
A disciplined first-pass diagnosis can be completed in about an hour if you already have Search Console access and a known traffic-drop date. The goal is not to produce a final recovery strategy in sixty minutes. The goal is to classify the incident well enough to decide what deserves deeper work and what should not be changed yet.
This sequence keeps the first hour focused on classification rather than premature remediation.
| Time | Check | Primary tool | Output |
| 0-10 min | Confirm the exact onset date | Search Console Performance | Record first persistent break in clicks, impressions, or position |
| 10-20 min | Check official update windows | Google Search Status Dashboard | Mark whether onset falls inside a confirmed rollout |
| 20-35 min | Segment the loss | Pages, queries, device, country, search type | Identify the smallest repeatable affected group |
| 35-45 min | Rule out technical causes | Indexing, URL Inspection, crawl stats, deploy log | Look for noindex, canonical, redirect, crawl, server, or migration changes |
| 45-52 min | Check external demand | Google Trends | Test whether major losing queries also lost market demand |
| 52-60 min | Corroborate SERP movement | Semrush, SISTRIX, AWR, tracked keywords | Decide whether movement is broader than your site |
At the end of the hour, assign one of four labels: likely algorithmic, likely technical, likely demand or SERP-layout driven, or unresolved. ‘Unresolved’ is a valid outcome. It is better than inventing confidence. For high-revenue sites, preserve screenshots, exported query and page comparisons, deployment logs, and update dates so later analysis is based on the same evidence snapshot rather than shifting dashboard views.
What Mistakes Most Often Produce a False Update Diagnosis?
The most common false diagnosis is temporal coincidence. Google makes many unannounced changes, notable updates can overlap with ordinary site releases, and organic traffic naturally fluctuates. A date match is therefore a lead, not a conclusion. The second mistake is starting with analytics sessions instead of Search Console exposure and ranking data. Analytics is valuable, but sessions can change because of consent, tracking, attribution, browser behavior, or site implementation even when Google Search performance is stable.
Another mistake is looking only at domain totals. A large loss from one URL can create a dramatic site graph, especially on smaller sites. Conversely, aggregate totals can hide widespread query losses if a few new winners offset them. Always review pages and queries. Also avoid checking only one market or device when those segments behave differently.
A fourth mistake is using a volatility tool as a causal label. High volatility shows movement, not why the movement happened or whether your site was affected by the same mechanism. A fifth mistake is making sweeping edits during an active rollout. If rankings are still recalculating, you can end up responding to an intermediate state, then have no clean baseline for judging whether your changes helped.
Finally, avoid treating every core-update loss as a technical defect or every spam-update loss as proof of deliberate spam. Core systems compare pages and sites in a changing competitive environment. Spam systems can neutralize signals without a manual action. Diagnosis should remain evidence-based and specific to the pages, queries, and signals that actually moved.
How Should You Document the Evidence Before Making Changes?
Create a short incident record before editing content. Record the first affected date, the confirmed Google rollout window if any, the comparison periods used, total click and impression change, average-position change, the top losing pages, the top losing query clusters, affected countries and devices, indexing or crawl anomalies, deployment dates, Google Trends findings, and volatility-tool observations. This turns a vague ‘update hit us’ narrative into a testable diagnosis.
For each proposed change, tie it to a finding. If a directory lost because its pages no longer match search intent, the intervention may be content restructuring. If a template lost indexed pages after a canonical change, the intervention is technical. If rankings are stable and CTR fell after a SERP redesign, the intervention may focus on titles, content format, or diversification rather than deleting pages. This mapping also makes later measurement possible because you know what each change was intended to fix.
Keep a control group when possible. Pages or directories that were not affected can tell you what remained stable across the same update and site infrastructure. If both winners and losers share the same template but differ in topic depth or freshness, that points away from a template defect. If every page on one template drops regardless of topic, the template deserves closer technical review.
What Happens Next After You Identify the Likely Cause?
The next step depends on the classification. For likely technical problems, fix the defect, validate representative URLs, and monitor recrawling and indexation. For demand declines, adjust forecasting and content priorities rather than trying to ‘recover’ nonexistent search interest. For SERP-layout losses, review the formats Google is surfacing and decide whether your content strategy can compete in those formats. For likely algorithmic losses, wait for rollout completion, prioritize the most affected sections, and improve the site based on specific gaps rather than generic update folklore.
Measure recovery over a realistic window. Google states that some meaningful improvements can show in days, while others may take months. Do not judge a sitewide quality project after forty-eight hours. At the same time, do not wait passively if you have strong technical evidence. Technical fixes should be implemented as soon as they are verified, while content and quality work should be planned, documented, and evaluated over longer periods.
As of August 29, 2026, Google’s public ranking history shows that the August spam rollout has completed. That makes this a good example of the discipline described throughout this guide: use a finished rollout window, compare the right Search Console periods, and confirm the pattern before changing the site. The enduring rule is simple. Correlation earns investigation; converging evidence earns a diagnosis.
Frequently Asked Questions
How soon after a Google update should I check Search Console?
You can monitor during a rollout, but for core updates Google recommends waiting at least one full week after the rollout finishes before making the main before-and-after comparison. That reduces noise from an update that is still moving through the results.
Does a traffic drop during an update prove the update caused it?
No. Timing is only one signal. Confirm ranking and impression changes, segment affected pages and queries, rule out technical and demand causes, and use broader SERP volatility as corroboration.
What is the strongest sign that an update affected my site?
A strong pattern is a persistent decline in positions, impressions, and clicks across a meaningful group of previously successful queries or pages beginning inside a confirmed rollout window, with no matching technical failure or demand collapse.
Should I rewrite pages immediately after a core update drop?
Usually not. Let the rollout finish, use the correct comparison periods, and identify whether the loss is small or large. Google specifically advises against drastic changes to content that is already performing well after a small position shift.
Can rankings stay stable while Google traffic falls?
Yes. Search demand can fall, click-through rate can change, and SERP features or AI-generated results can alter how users interact with the page. Compare impressions, CTR, device segments, Trends data, and live SERP layouts before assuming a ranking loss.
Sources
- Google Search Central – Debugging drops in Google Search traffic; used for causes, segmentation, technical checks, and Trends workflow.
- Google Search Central – Google Search core updates and your website; used for rollout comparison guidance, small versus large drop examples, and recovery timing.
- Google Search Status Dashboard – Ranking incident history; used for 2026 update dates and durations.
- Google Search Status Dashboard – May 2026 core update incident details; used for the May 21 to June 2 rollout window.
- Google Search Status Dashboard – June 2026 spam update incident details; used for the June 24 to June 26 window and global, all-language scope.
- Google Search Central – Search Console overview; used for indexing, inspection, security, and performance diagnostics.
- Google Search Central Blog – Search performance data deep dive; used for definitions of clicks, impressions, CTR, position, and available dimensions.
- Google Search Central – Google Trends guidance; used for seasonality, changing demand, and industry benchmarking.
- Google Search documentation changelog – August 15, 2026 documentation updates; used for AI Overview logging clarification and core-update documentation changes.
- Semrush – Sensor methodology; used for the fixed-keyword daily comparison and Levenshtein-distance calculation description.
- SISTRIX – Visibility Index methodology and scale; used for daily recalculation, 100 million data points, 100 million domains, and 40-country coverage.
- Advanced Web Ranking – SERP Volatility documentation; used for volatility bands and URL, intent, and feature-change analysis.
- Search Engine Land – Search Console reports for diagnosing traffic drops; used for device, search appearance, and crawl-stat diagnostic ideas.
- Google Search Central Blog – May 2022 core update announcement by Danny Sullivan; used for the quoted reminder that a core update loss may not indicate something is broken.