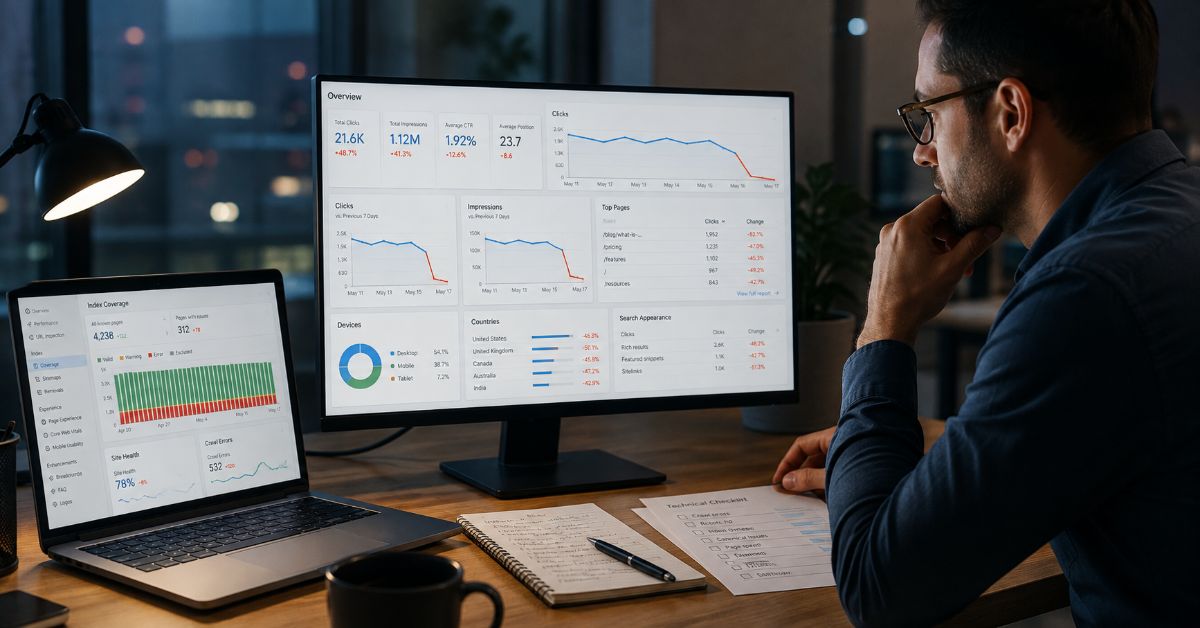
I treat an overnight traffic drop as a diagnostic problem, not proof of a Google penalty. If you are asking, “why did my traffic drop overnight?”, the fastest answer is to compare Google Search Console against your analytics, identify exactly which pages and queries lost impressions or clicks, then check technical failures, Google update timing, manual actions, security issues, demand shifts, and SERP changes in that order. A sharp one-day fall can come from tracking or reporting errors, accidental noindex or robots rules, broken redirects, canonical changes, server problems, a ranking update, a manual action, hacked content, seasonality, or a change in how Google presents results. The shape and scope of the loss usually tell you where to look first. I do not start by rewriting pages or deleting content. I start by proving what actually changed, because a ranking problem, an indexing problem, and a measurement problem can produce similar-looking charts while requiring completely different fixes.
That discipline matters in 2026 because both search systems and reporting surfaces can move quickly. Google records known Search Console data anomalies, and its August 2026 notes include logging issues that affected some reported impressions and clicks without changing underlying Search performance. Google also closed an August 2026 spam update after a 2-day, 16-hour rollout, while third-party SE Ranking data reported unusually heavy top-10 churn during that update. Those examples show why correlation is evidence, not a diagnosis. A site can lose clicks during a confirmed update because rankings changed, but it can also lose clicks because demand softened, a result feature absorbed attention, a canonical changed, or analytics stopped recording correctly. The checklist below is built to separate those possibilities. It gives site owners, in-house SEOs, publishers, and agencies a repeatable process for the first hour, first day, and recovery period, with enough evidence at each step to know when to stop investigating one theory and move to the next.
What this means for site owners, SEOs, and publishers
A sudden drop should trigger evidence collection before remediation, because the wrong fix can make a temporary or localized problem worse. Google itself recommends using Search Console to distinguish algorithmic updates, technical issues, security problems, seasonality, and reporting anomalies in its traffic-drop debugging guide. That is the operating principle for this checklist.
For a site owner, the practical goal is to answer three questions quickly: Is the loss real? Is it limited to Google organic search? Is it concentrated in a specific set of pages, queries, devices, countries, or search appearances? For an in-house SEO, the next layer is change control: what deployments, CMS edits, migrations, template changes, internal-link changes, feed changes, or consent updates went live immediately before the loss? For an agency, the priority is preserving a clean evidence trail so the client sees what is confirmed, what is plausible, and what has been ruled out.
If the evidence points to rankings rather than measurement or crawling, move into the site’s Ranking Recovery coverage only after the technical checks are clean. Recovery work is much more useful when it starts from a page and query cohort instead of a vague sitewide fear.
Why did my traffic drop overnight? Start with the shape of the loss
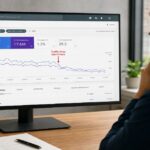
The first clue is the pattern of the drop: a cliff, a slope, a click-only loss, or a segment-specific loss each suggests a different investigation path. Google illustrates several traffic-drop shapes in its debugging documentation because graph shape can help separate technical failures, algorithmic changes, seasonality, and ordinary demand movement.
Read the pattern before the percentage
A near-vertical fall across most landing pages can point to a tracking outage, a sitewide technical block, a major availability problem, a broad manual action, or a large ranking event. A gradual decline over weeks is more consistent with demand erosion, competitive losses, content decay, or a slower redistribution of rankings. A drop isolated to one directory points toward template, internal-link, canonical, or content-class issues in that section. A click drop with comparatively stable impressions requires a different question: did positions, SERP layout, titles, or search intent reduce click-through rate without reducing visibility?
Do not judge the graph only in percentages. A 40 percent loss on a page that normally receives ten clicks is noisy. A 15 percent loss across thousands of high-value queries can be operationally serious. Compare absolute clicks and impressions, median or average position, affected page count, and business impact together.
Use this pattern table to choose the first branch of the investigation.
| Observed pattern | Most likely branch | Evidence to collect first | First check |
| Clicks and impressions fall together across most pages | Ranking, indexing, or broad technical issue | GSC pages, queries, position, index status | Search Console plus live URL tests |
| Clicks fall while impressions stay relatively stable | CTR, SERP layout, intent, title/snippet, device mix | Position, device, search appearance, live SERPs | GSC segmentation |
| One directory or template falls sharply | Deployment, canonical, robots, internal linking, content-class issue | Affected URL pattern and recent change log | URL Inspection and crawl |
| All channels fall, not only Google organic | Analytics, consent, site availability, demand, or business event | GA4/server logs and channel comparison | Analytics and server monitoring |
| Drop repeats on similar dates or seasons | Demand or seasonality | Year-over-year data and Google Trends | GSC comparison plus Trends |
Is it traffic, rankings, or tracking?
The word traffic hides three separate signals. Traffic is visits recorded by analytics. Search visibility is impressions and rankings reported by Google Search Console. Indexing is whether Google can include a URL in Search at all. If analytics sessions collapse but Search Console clicks remain normal, your priority is tracking, consent, redirects, or analytics attribution. If Search Console clicks and impressions collapse together, the problem is closer to Search visibility. If impressions disappear only for URLs that also show indexing exclusions, the investigation becomes technical before it becomes editorial.
Step 1: Prove the drop is real before diagnosing Google
A real traffic loss should appear consistently across independent evidence, while a reporting problem often appears in one system but not another. Start with Google Search Console, your analytics platform, and server or CDN logs if available. Compare the same date range against the immediately preceding period and, when seasonality matters, the same weekdays or same period last year.
Before escalating the issue, check Google’s Search Console data anomalies log. Google says this page records known reporting issues from roughly the last 3 to 16 months. In August 2026, for example, Google documented an August 13 Discover logging error and an August 13 to 17 Generative AI reporting error. Earlier in 2026, Google also corrected an impressions logging issue that had affected reported impressions and related metrics for a long historical span while clicks were not affected. These are reporting events, not proof that sites lost the corresponding real-world search exposure.
Next, compare Google organic against direct, referral, paid, email, and other major channels. If every channel dropped at the same minute, an SEO explanation becomes less likely than a site outage, consent or tag change, checkout or routing problem, or analytics break. If only Google organic dropped while Bing, direct traffic, and server requests look normal, Search-specific causes move up the list.
Finally, look at data freshness. Do not compare a partially processed current day against a complete prior day and call the difference a collapse. Use a stable comparison window unless the incident is so large that partial data still makes the direction obvious.
Step 2: Identify exactly what lost visibility
The fastest useful diagnosis comes from segmentation: find the smallest coherent set of pages and queries that explains most of the loss. In Search Console, compare before and after periods and inspect pages, queries, countries, devices, search type, and search appearance rather than relying on the property-level chart.
Start with pages. Sort by click difference, then repeat with impression difference. Group affected URLs by directory, template, content type, product family, market, or editorial team. A sitewide chart can hide the fact that one directory lost 70 percent while the rest of the domain is flat. That distinction changes the likely cause from broad algorithmic impact to something local, such as a template deployment, internal linking change, canonical pattern, inventory issue, or intent shift in one topic cluster.
Then inspect queries and position. Google’s core update guidance explicitly distinguishes small and large position drops. Google gives a small example such as moving from position 2 to 4, where drastic action is not recommended, and a large example such as moving from 4 to 29, where deeper assessment is appropriate. It also recommends separating Web, Images, Video mode, and News because the impact can differ by search type.
Be careful with page-level interpretation after canonical or redirect changes. Search Console says most Performance report data is assigned to the canonical URL, and clicks on a duplicate can be credited to the canonical. A canonical change can therefore move reported performance between URLs even when user demand did not vanish. This is one reason a page report can look alarming after a migration or consolidation while the property-level story is less severe.
For extra diagnostic ideas, Search Engine Land’s review of underused Search Console reports for traffic drops highlights device segmentation, search appearance, and Crawl Stats. Those cuts are especially useful when position appears stable but click opportunity has changed.
Build a before-and-after baseline that survives noise
A useful baseline does more than compare two totals. Export the affected period and a clean comparison period, then preserve URL, query, clicks, impressions, CTR, and position at the same granularity. Add a page-type or directory label so you can pivot the data by content class. If the site is international, keep country and language separate. If mobile and desktop behavior differs materially, do not average them together too early. The purpose is to create a dataset that can answer new questions without forcing you to rebuild the investigation each time a theory changes.
Use both absolute and relative change. Relative change helps reveal a small but severely affected cohort, while absolute change identifies the pages or queries responsible for the largest business loss. A URL that falls from 20 clicks to 5 has a 75 percent decline but loses 15 clicks. A URL that falls from 5,000 clicks to 4,000 loses only 20 percent but removes 1,000 clicks. Both matter, but they belong in different priority queues. The same logic applies to conversions and revenue if organic-search business impact is available.
Also compare winners. When one group loses and another group gains during the same period, the contrast can reveal the mechanism. If pages on an old template fall while pages on a new template hold, the template becomes a stronger lead. If informational articles fall while product pages stay stable, intent or content-type evaluation may be involved. If nearly every page falls by a similar amount, sitewide or market-wide explanations deserve more attention. A recovery analysis that studies only losers misses half of the evidence.
Keep a control group when you make fixes. Choose similar pages that were affected but will not be changed immediately, provided leaving them untouched does not create user or security harm. That control group helps distinguish improvement caused by your work from a broader rebound in rankings. SEO data is noisy, and Google results can move while you are changing the site. A controlled rollout cannot eliminate that noise, but it makes the result easier to interpret than a sitewide rewrite released in one batch.
Step 3: Check technical failure before algorithm theories
A sudden technical change can remove or weaken search visibility faster than most content changes, so technical controls belong ahead of speculative algorithm analysis. Test representative high-traffic URLs from each affected template, not just the home page. You want to know whether Googlebot can request the page, whether the response is correct, whether the rendered page contains the expected content, and whether indexing directives still say what you intended.
Run the fast technical checks
Check robots rules and noindex first. Google’s noindex documentation states that when Googlebot can crawl a page and sees a noindex meta tag or X-Robots-Tag, Google will drop that page from Search. Also remember that robots.txt is primarily a crawl-control mechanism, not a reliable way to keep a web page out of Google’s index. A deployment that accidentally adds noindex to a shared template can create a large visibility loss once Google recrawls affected pages.
Check HTTP status codes and server availability next. A release that turns important pages into 404s, soft 404s, redirect loops, or repeated 5xx responses can create abrupt problems. Compare CDN logs or server monitoring against the moment the Search Console curve changes. If crawling also falls or errors spike after deployment, the technical hypothesis gets stronger.
Check the rendered version of JavaScript-heavy pages. If primary content, links, product information, or pagination disappeared from rendered HTML after a frontend release, users may still see something in a browser while crawlers receive an incomplete or delayed version. Use URL Inspection and your own rendered-crawl tooling to compare a healthy URL with an affected one.
Canonical and redirect traps deserve their own pass
Canonicalization problems can redistribute or suppress visibility in ways that look like overnight ranking loss. Google’s canonicalization guidance explains that Google selects a representative canonical from duplicate or very similar pages and may choose a different canonical from the one a site indicates. Signals include redirects, rel=canonical annotations, and sitemap inclusion, but canonical declarations are not absolute commands.
After a template or CMS change, inspect self-referencing canonicals, cross-domain canonicals, protocol and hostname variants, pagination patterns, parameter URLs, and redirected destinations. Google’s canonical troubleshooting documentation notes that even after content fixes, Google may keep pages in a duplicate cluster for up to two weeks while re-evaluating them. That timing matters when deciding whether a canonical fix has failed or simply has not been fully processed yet.
If the drop follows a migration, compare old and new URLs, redirects, robots rules, noindex settings, server capacity, and sitemaps. Google’s site-move troubleshooting guidance calls out accidental noindex or robots blocks, incorrect redirects, crawl errors, insufficient server capacity, and outdated sitemaps as common migration mistakes. The site’s SEO Basics archive is the natural internal destination for foundational crawl and indexing concepts that support this checklist.
Step 4: Check Google systems, updates, and SERP volatility
Once measurement and technical checks are clean, correlate the loss with confirmed Google events and independent SERP volatility. Correlation becomes persuasive when the timing matches, affected queries show ranking movement, competitors move in the opposite direction, and multiple tracking sources show unusual volatility. A date match alone is not enough.
Use the Google Search Status Dashboard as the official starting point. Google’s dashboard documentation says it covers issues that affect many sites or users and lists ranking updates relevant to site owners, with incident and update history available for five years. As of August 29, 2026, the history shows an August 2026 spam update that began August 18 and lasted 2 days, 16 hours, followed by no active incident in the latest available dashboard snapshot.
That recent update is a useful example of why outside data can help quantify context without proving causation for your site. Search Engine Land reported SE Ranking data on the August 2026 spam update showing that 16.71 percent of URLs previously in the top 10 fell beyond position 100 during the update, compared with 9.2 percent in a similar July baseline period. The report described this as an 82 percent increase in top-10 URLs dropping out of the top 100. Those figures describe a third-party dataset, not the experience of every domain.
For ongoing site-side checks, use AlgoUpdateTimes’ Update Impact Checker to compare the date your traffic changed with confirmed core, spam, and Discover updates, then review the site’s Algorithm Updates archive for relevant update context.
Use external trackers as confirmation, not diagnosis
Semrush Sensor measures SERP volatility on a 0 to 10 scale using a fixed keyword set and daily result comparisons. Its documentation classifies 0 to 2 as low, 2 to 5 as normal, 5 to 8 as high, and 8 to 10 as very high. SISTRIX uses a different visibility model: its published calculation describes one million representative queries and up to 100 organic results per query, producing 100 million base data points before weighting by search volume and expected click-through rate. Different methodologies are valuable because agreement across tools reduces the chance that you are reacting to one tracker-specific artifact.
To move from correlation toward causation, look for four kinds of alignment. First, timing: the ranking loss begins inside or very close to the confirmed rollout window. Second, scope: the pages and queries that fell match the type of search visibility that moved in your own data, rather than unrelated channels. Third, external confirmation: competitors and independent trackers show meaningful movement at the same time. Fourth, persistence: the change remains after normal day-to-day volatility and after the rollout has settled. The more of these conditions you can document, the stronger the update hypothesis becomes.
Even then, avoid statements such as ‘Google penalized the site’ unless you have a manual action or another specific enforcement signal. Broad ranking updates are comparative systems. Your pages can move because Google’s evaluation of them changed, because other pages became more competitive, or because the composition of the result page changed. The recovery response should be based on the observed losing cohort and its weaknesses, not on a label alone.
The table below summarizes what each external signal can and cannot tell you.
| Source or tool | Verified reference fact | Useful for | Do not conclude |
| Google Search Status Dashboard | Ranking updates and broad incidents; history available for five years | Confirming official timing and system-wide incidents | That your site was affected just because dates overlap |
| Search Console data anomalies | Known reporting issues recorded for roughly the last 3 to 16 months | Ruling out measurement artifacts | That every unexplained drop is a Google logging error |
| Semrush Sensor | 0-10 volatility scale; 0-2 low, 2-5 normal, 5-8 high, 8-10 very high | Checking broad SERP turbulence | That a high score identifies the cause of your site loss |
| SISTRIX Visibility Index | Representative million-query dataset with up to 100 organic results per query in its published model | Comparing domain and competitor visibility trends | That its keyword universe exactly matches your own demand |
Step 5: Rule out manual actions and security problems
Manual actions and security issues are lower-frequency causes than normal algorithmic or technical movement, but they are high-impact and easy to check. Do not skip them simply because you believe the site has always followed best practices.
Google’s Manual Actions report documentation says a manual action is applied when a human reviewer determines that pages are not compliant with Google spam policies. Some or all of a site may be ranked lower or omitted from Search, and Search Console notifies affected owners in the Manual Actions report and message center. If the report is clean, do not invent a hidden manual penalty to explain a ranking drop. Algorithmic systems can change rankings without a manual-action notification.
Also check the Security Issues report. Google uses it for hacked content, malware or unwanted software, and social-engineering issues. Affected pages can receive warning labels in search results or browser interstitials, which can suppress clicks even if some rankings remain. The report also notes that example URLs may be only a sample, so a clean-up has to address the underlying issue across the site rather than only the listed pages.
Step 6: Test demand, seasonality, SERP layout, and click loss
Not every traffic drop is a ranking drop. If impressions are stable but clicks decline, or if average position changes only slightly, investigate demand and the shape of the search results before concluding that the site lost relevance.
Use Google Trends alongside Search Console to see whether the topic itself is shrinking, spiking, or moving seasonally. Google’s traffic-drop guide explicitly recommends Trends for separating site-specific problems from broader changes in search interest. Compare branded and non-branded demand where possible, and compare year over year for seasonal businesses rather than relying only on the previous seven days.
Then inspect live SERPs for the queries that lost the most clicks. Ads, shopping units, local packs, video, discussions, answer features, AI experiences, and other modules can change the amount of attention available to a conventional blue link. Search Engine Land’s Search Console diagnostic article makes the same point through device and search-appearance segmentation: mobile and desktop layouts can create very different click opportunities even when an organic listing remains present.
A useful rule is to separate three cases. If impressions and position are stable but CTR falls, look at snippets and SERP competition. If impressions fall while position stays broadly stable, demand or eligibility for a search feature may have changed. If position falls across the same high-value query set, ranking evaluation becomes the stronger explanation.
Step 7: Audit content and intent when rankings, not crawling, changed
Content and intent analysis belongs after you have shown that pages remain crawlable and indexed, reporting is healthy, and rankings actually moved. At that point, compare the pages that lost with the pages that held or gained. You are looking for patterns, not a universal checklist score.
Google says core updates are broad changes that do not target specific sites or individual pages, and it advises waiting at least a full week after a core update finishes before making the main before-and-after Search Console comparison. In its core update guidance, Google also recommends avoiding quick-fix changes and focusing on sustainable improvements that make sense for users. Some improvements can be reflected in days, while sitewide quality reassessment can take several months.
Build cohorts of losing and stable pages. Compare intent match, freshness needs, first-hand experience, original analysis, information gain, source quality, factual maintenance, author transparency, page purpose, intrusive elements, internal linking, and whether the page still deserves to be the best result for its query. A page can be technically perfect and still lose because competitors now answer the query more directly or because the query’s dominant intent has shifted.
Do not convert this into cosmetic editing. Reordering headings, changing a date, or adding several hundred words does not automatically improve usefulness. If the losing cohort is product-comparison content, ask whether the pages offer original testing, clear decision criteria, current availability, and meaningful tradeoffs. If the losing cohort is news or update coverage, ask whether the pages explain what changed, when it changed, who confirmed it, and what readers should do differently.
Google’s August 2024 core update announcement, authored by Search Advocate John Mueller, said the update aimed at “showing more content that people find genuinely useful” and less content made mainly to perform in Search. The wording is brief, but the implication is durable: recovery work should strengthen the page’s reason to exist for the reader, not merely add more SEO signals. See the official August 2024 core update post for the original statement.
Step 8: Build a page-level recovery plan
A recovery plan should be prioritized by evidence, traffic value, and repeatable page patterns, not by whichever URL looks worst on a dashboard. Start with the pages and query groups responsible for most of the lost clicks or conversions. For each cohort, record the suspected cause, supporting evidence, proposed change, owner, release date, and the metric that would confirm improvement.
For technical causes, fix the shared system before touching page copy. If a canonical template is wrong, repair the template and validate representative URLs. If redirects are broken, correct the mapping and retest. If internal links disappeared from navigation, restore crawlable pathways. If the problem is content or intent, improve a controlled batch of high-value pages first, then compare performance with similar untouched pages before scaling the intervention.
Keep annotations. Mark major deployments, migrations, template releases, feed changes, and content refreshes in your analytics or an external change log. Future investigations become faster when you can line up a traffic curve with a known release instead of reconstructing history from chat messages and commit logs.
For agencies and larger teams, assign a confidence level to every diagnosis. Confirmed means direct evidence exists, such as a noindex tag on losing URLs. Probable means multiple signals align, such as an update date, ranking loss, competitor gains, and high external volatility. Possible means the theory still needs evidence. This keeps stakeholders from hearing speculation as fact.
Step 9: What should you do in the first 24 hours?
In the first 24 hours, preserve evidence, rule out catastrophic technical problems, and resist irreversible SEO changes. The goal is not to recover every click immediately. The goal is to identify the correct failure class quickly enough that the next action is safe.
First, capture screenshots or exports of Search Console, analytics, server status, and affected page lists. Second, test representative URLs from every affected template for status code, robots access, noindex, canonical, rendering, and redirects. Third, check the Search Status Dashboard, Search Console data anomalies, Manual Actions, and Security Issues. Fourth, segment losses by page, query, device, country, and search type. Fifth, review releases and content changes from the preceding days. Only then decide whether the incident is measurement, technical, algorithmic, security-related, demand-driven, or still unresolved.
If a sitewide technical error is confirmed, fix and validate it immediately. If a Google update is still rolling out and the site is technically healthy, collect data rather than making broad reactive edits. If the issue is limited to one directory, isolate the shared template or content pattern. If the evidence is mixed, keep the investigation open rather than forcing a single explanation.
What should you avoid after a sudden traffic drop?
Avoid mass deletion, sitewide noindex changes, wholesale rewrites, indiscriminate disavow files, or migration rollbacks without evidence. Those actions can destroy useful signals and make it harder to tell what caused the original loss. Google’s core update guidance specifically warns against quick-fix changes and says deleting content should be a last resort when the content genuinely cannot be salvaged.
Also avoid chasing every volatility chart. A high third-party volatility score says search results are moving more than usual, not why your pages moved. Do not treat a clean Manual Actions report as proof that nothing algorithmic happened, and do not treat the presence of a core or spam update as proof that every decline during the rollout was caused by it.
Most importantly, do not edit dozens of variables at once. If you change content, internal links, titles, templates, canonicals, and redirects simultaneously, you lose the ability to learn from the outcome. Controlled changes are slower emotionally but faster diagnostically.
How long can recovery take?
Recovery time depends on the cause and on how quickly Google and users can observe the correction. Tracking fixes can appear as soon as data collection resumes. Server and redirect fixes can restore accessibility quickly, but Search reporting and recrawling can lag. Google says canonical cluster re-evaluation can take up to two weeks after fixes in some cases.
For core-update-related content improvements, expectations should be longer. Google says some changes can take effect in a few days, but it can take several months for systems to learn and confirm that a site is consistently producing helpful, reliable, people-first content. Google also notes that you do not always have to wait for a major announced core update, because smaller changes to ranking systems happen continuously.
Measure recovery at the same level you diagnosed the loss. If a directory fell, track that directory. If a query class moved, track that query class. Sitewide averages can hide meaningful recovery in the exact cohort you fixed.
Frequently Asked Questions
Can Google traffic drop overnight without an algorithm update?
Yes. Tracking failures, noindex tags, robots changes, redirect problems, server outages, canonical mistakes, hacked content, demand shifts, and SERP layout changes can all create sudden losses without a new ranking update being the cause.
How do I know whether a traffic drop is a Google penalty?
Check the Manual Actions report in Search Console. If it is clean, you do not have evidence of a manual action. Rankings can still change algorithmically, so a clean report does not mean rankings must remain stable.
Should I change content while a core update is rolling out?
Usually, avoid broad reactive changes unless you have confirmed technical or factual problems. Google recommends waiting at least a full week after a core update finishes before making the main before-and-after Search Console assessment.
Why did clicks fall if my average position barely changed?
Check impressions, device, search appearance, CTR, and the live SERP. A stable average position can still produce fewer clicks when demand changes, result features become more prominent, or your snippet attracts less attention.
What is the first technical check after a sudden ranking drop?
Test representative affected URLs for crawl access, HTTP status, noindex, canonical, rendering, and redirects. A shared template error can explain a large drop faster than a page-by-page content theory.
What’s next: turn the incident into a repeatable diagnostic system
A sudden search decline becomes manageable when the team follows the same order every time: validate measurement, segment the loss, test technical controls, check official Google systems, review manual and security reports, assess demand and SERP changes, then investigate content and intent. That sequence protects you from the two most expensive mistakes in SEO incident response: fixing the wrong problem and changing too many things before you understand the evidence.
I would keep this checklist beside the site’s deployment log and Search Console exports, then update it after each real incident with the checks that proved most useful. Over time, your own history becomes a stronger diagnostic asset than any generic volatility chart because it shows how this specific site behaves during releases, migrations, Google updates, seasonal shifts, and reporting anomalies. The goal is not to eliminate volatility. The goal is to identify its cause quickly, make the smallest justified correction, and preserve enough evidence to know whether the correction worked.
Sources
Google Search Central – Debugging drops in Google Search traffic – Primary framework for diagnosing organic Search traffic declines and using Search Console plus Google Trends.
Google Search Central – Google Search core updates and your website – Core update analysis timing, small versus large position drops, change guidance, and recovery expectations.
Google Search Status Dashboard – History – Official ranking update and Search incident dates, including the August 2026 spam update.
Google Search Central – Using the Google Search Status Dashboard – Dashboard scope, incident lifecycle, ranking update coverage, and five-year history explanation.
Google Search Console Help – Data anomalies in Search Console – Known reporting anomalies, including 2026 logging issues.
Google Search Console Help – Manual actions report – Definition, impact, notifications, and remediation path for manual actions.
Google Search Console Help – Security issues report – Hacked content, malware, social engineering, warning behavior, and review process.
Google Search Central – Block Search indexing with noindex – How noindex removes crawlable pages from Search and why robots.txt is not an indexing-control substitute.
Google Search Central – Canonicalization – How Google chooses canonical URLs and why canonical preferences may differ from Google-selected canonicals.
Google Search Central – Fix canonicalization issues – Canonical troubleshooting and the note that duplicate-cluster re-evaluation can take up to two weeks.
Google Search Central – Site moves and migrations – Common migration mistakes including blocking, redirects, crawl errors, server capacity, and sitemaps.
Semrush – What is Semrush Sensor? – SERP volatility scale and interpretation thresholds.
SISTRIX – Calculation of the Visibility Index – Published methodology for representative queries, organic result collection, weighting, and daily data.
Search Engine Land – 3 Google Search Console reports for diagnosing traffic drops – Industry guidance on device, search appearance, and Crawl Stats segmentation.
Search Engine Land – August 2026 spam update impact – Third-party SE Ranking volatility data used as a dated example of update-period churn.
Google Search Central Blog – August 2024 core update – John Mueller-authored announcement used for the quoted people-first update framing.